Day Trading for a living – is it possible?
Trade from anywhere – no long commutes anymore. Forget 9 to 5! A laptop with an Internet connection is the only thing you need.
Forex is the best example. This market is the most liquid and it is open round the clock – 5 days a week. You don’t even need to invest a lot of money to get started – a few hundred dollars is enough.
Unfortunately, the statistics is really depressing: recent study reveals that up to 97% of traders lose money.
Why? There are many reasons, but psychology and stress are on top of the list.
Can we beat the stress and avoid losses?
Or, the better question should be how to become one of those 3% who succeed?
What makes a successful trader?
The most important thing is the method. The next one is the discipline to follow the method. Without discipline, you really have no method.
Says Robert Prechter, who won the U.S. Trading Championship with a record 444% return.
We couldn’t agree more. Unfortunately, it’s much easier said than done.
From our experience, the best way to achieve both is software. Especially nowadays, when trading has become dominated by HFT and AI.
For individual traders like us, proper software is the only chance against
Software is also invaluable in overcoming stress that leads to trading failures.
We’ve spent many years developing our method and the software that implements it. Meaning it follows the method automatically, substantially reducing your stress.
And the best part, our software is capable to follow any other method you want. And much more.
Now, we are going to share our software.
Read on.
Market timing: the million-dollar question
So, a proper method is the key not to be in these 95% who lose. But what is a method, exactly?
To put it simple, we need a rule – clear and predefined! – when to enter or exit the market.
“Buy low, sell high” – this advice is well-known.
But how exactly can we decide when to buy and when to sell? If you ever tried to trade, even on a demo, we don’t need to explain to you how difficult it is.
There is no other way than to guess the market’s next move. How to do that, is – literally – a million-dollar question. Or even billion!
You can try to follow the market movements. For example, you see a swift 5 pips move up and you buy. However, random trades are seldom winners.
Quite popular are predictions based on Elliott Waves theory. For example, if we see an impulsive market advance in 5 waves, then it must be followed by a correction.
Indicators are even more wide-spread. The simplest example: if RSI falls below 30, the market is oversold, so this is a “buy” signal.
We started with indicators ourselves. But eventually we had to give them up as they just don’t work for market timing. And day trading is all about market timing.
Why indicators are useless for market timing
They introduce a time lag.
Meaning, the signals generated from indicators are based on the price action from the past. For example, on the M5 graph, a new reading comes every 5 minutes.
If you’ve watched the markets for some time, you know how much can happen during these 5 short minutes. To say nothing of the longer time frames.
A similar situation with Elliott waves. They can hint at a very probable market action, but it’s nearly impossible to know when exactly it will happen. In our example above, the 5th wave can always extend – in full accordance with the Elliott theory itself!
Put another way, we always stumble upon a kind of an “uncertainty principle”. The clearer the market picture is, the longer it takes us to get it. And when
This is kind of obvious: nobody can predict the future.
Another – little less evident – problem with indicators comes from the fact that they are well-known. And when a lot of people is watching the same charts and expecting the same market behavior, it rarely happens. On the contrary, the market is known to deliver the maximum possible damage to as many people as it only can.
And finally, there is one more principal problem with any market signals based on price averaging:
“… the 200 moving average crosses the 50 moving average…” this kind of signals is probably familiar to you.
Even assuming this crossing happened right now (but not at least 50 periods back), signals like this are of little use for day trading.
Because you have to buy and sell in real-time
Where – instead of clean and smooth average graphs – you may find wild price swings within seconds and hundreds of new ticks coming each minute. If you ever looked at the tick graphs, you know what we mean.
And in day trading every single pip matters. Especially if you use leverage.
The swings can hurt you even when you guessed the time right. If your market entry was not perfect and the price later moved in the unfavorable direction. Which is what the market does most of the time.
Let’s take an example.
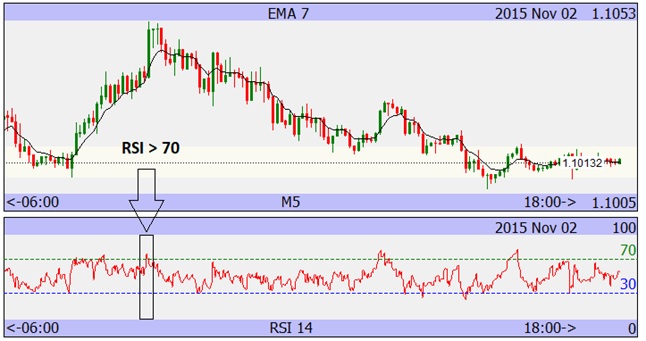
This M5 graph shows a quite calm European trading session. There is a nice market top around 9 AM (all times are GMT). Is it a clear profitable setup?
Let’s zoom in.
The figure below shows the real-time (tick) graph from the boxed area. Note that the price swings more than 20 pips.
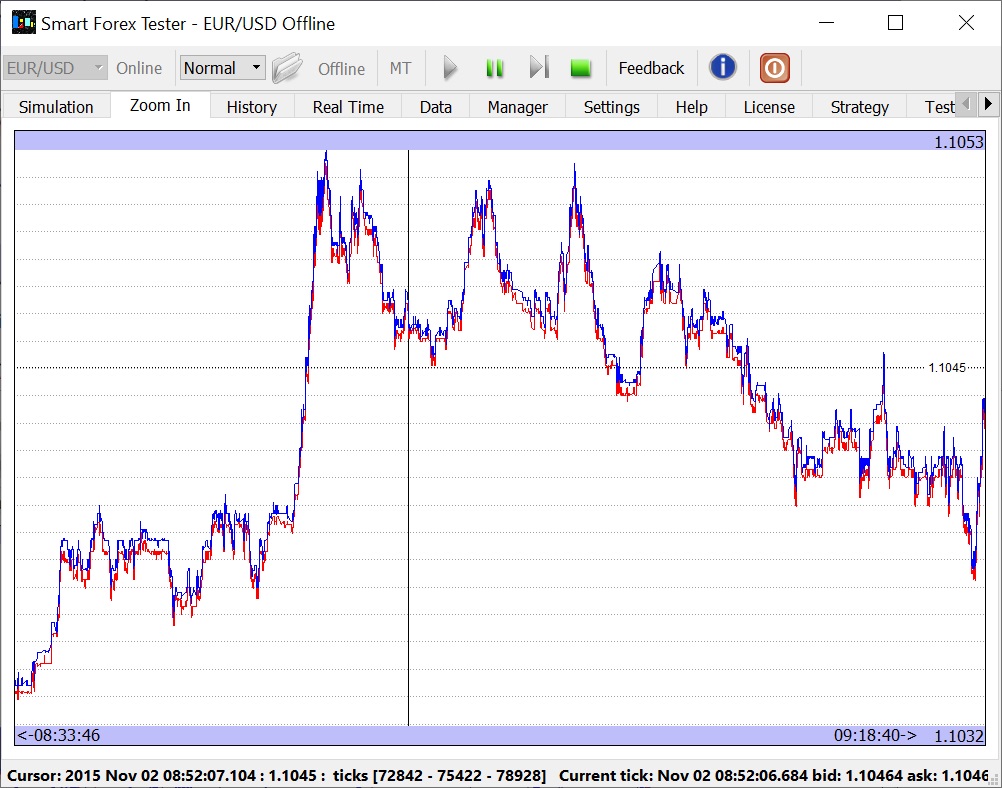
Imagine time is around 8.30 AM. You’ve been watching the market from its open (7 AM) and you see it went up nicely.
Around 9 AM you notice the market appears to have peaked and starts to move down. You need to make a quick decision – and opening a short position looks absolutely justified.
You have no way of knowing that in ten minutes the market will surge another 10 pips (at each moment you could only see the part of the graph to the left of this time). But if you sold then, your position would have been in the red for quite a while.
Unfortunately, this is a typical situation. And like we said, this session was a relatively calm one. Lots of sessions have much wilder (and larger) price movements.
Looks like a dead end? In a way, it is – unfortunately, even all the power of modern AI can’t help us predict the markets.
But we do need the method – how can we get one?
We’ve struggled for quite some time until, fortunately, we found our own solution.
And the best part is, our approach can work with any other method!
Read on.
What can we predict in the market?
We know we can’t predict the market direction.
But even though the markets are random, there is one sure thing there.
Namely, prices always move from an extreme in one direction to the next in the opposite one. You can spot these zigzags in every market.
Why do markets behave like this?
Because nobody knows what the “right” price is. For example, as long as there are more buyers than sellers, the price will go up. Then, at some point, demand dries up – so, the price forms a top and then goes down. And then up – and it continues indefinitely.
This is how the markets work – the price discovery mechanism.
Why are we telling you all this?
Because we created an algorithm that can nail these market turns almost in real-time.
Let’s return to our example.
The figure below shows that our algorithm was able to signal a top (marked with a small red dot) just 2 pips shy of the maximum price of the whole session.
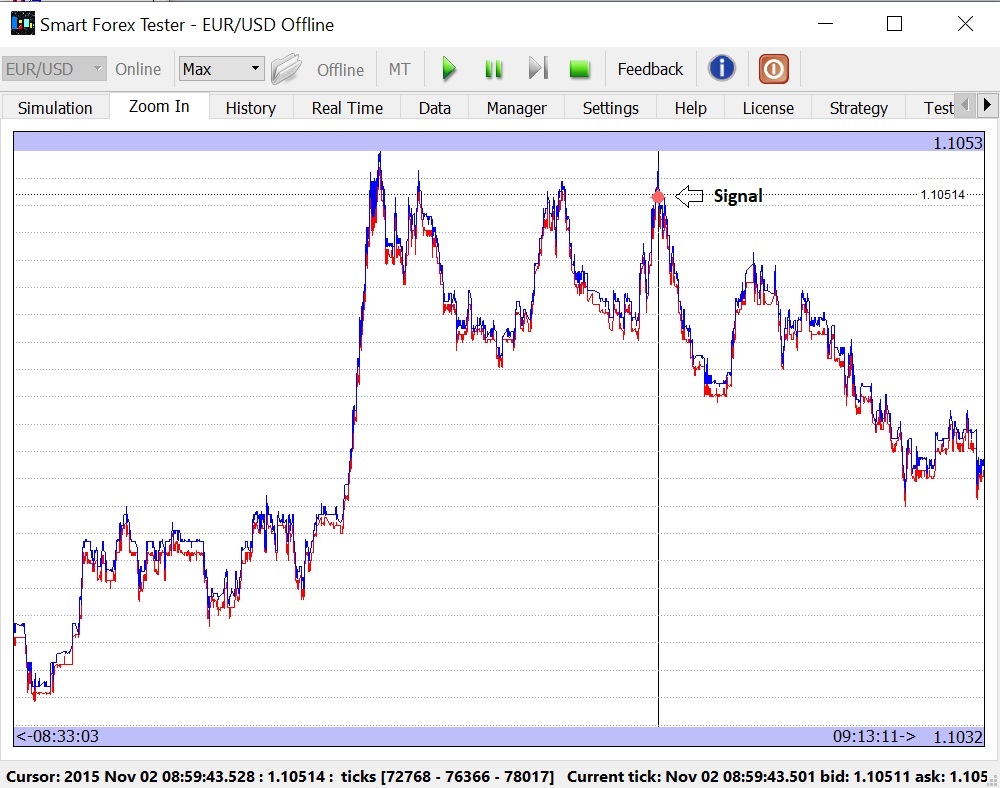
Moreover, our software that implements the algorithm can automatically trade on these signals.
Meaning that if you wanted, in the example above, you could have the software open a position for you – automatically.
You can imagine that this know-how not only gives us BOTH a method and a means to follow it, but also helps reducing stress dramatically – because of automation.
Now you can get this Software instantly! ADD TO CART
How it works – the method in a nutshell
Why does our method stand out? What does it do differently?
We follow the big picture the way indicators do but we combine it with real-time analysis of the internal structure of the price action. This way we can generate the signal only when the reversal is most probable.
Can our algorithm predict the future? Of course, not.
But the keyword here is “real-time”. The algorithm works fast enough to give you a competitive advantage over many other market participants, in particular – manual traders.
Let’s continue with our example and zoom in even more.
The graph below now spans only 14 s. You can clearly see the bid (red) and ask (blue) lines. A chaotic graph like this is what you see when you are trading. In addition, it is fast-changing: you can have new prices coming many times each second!
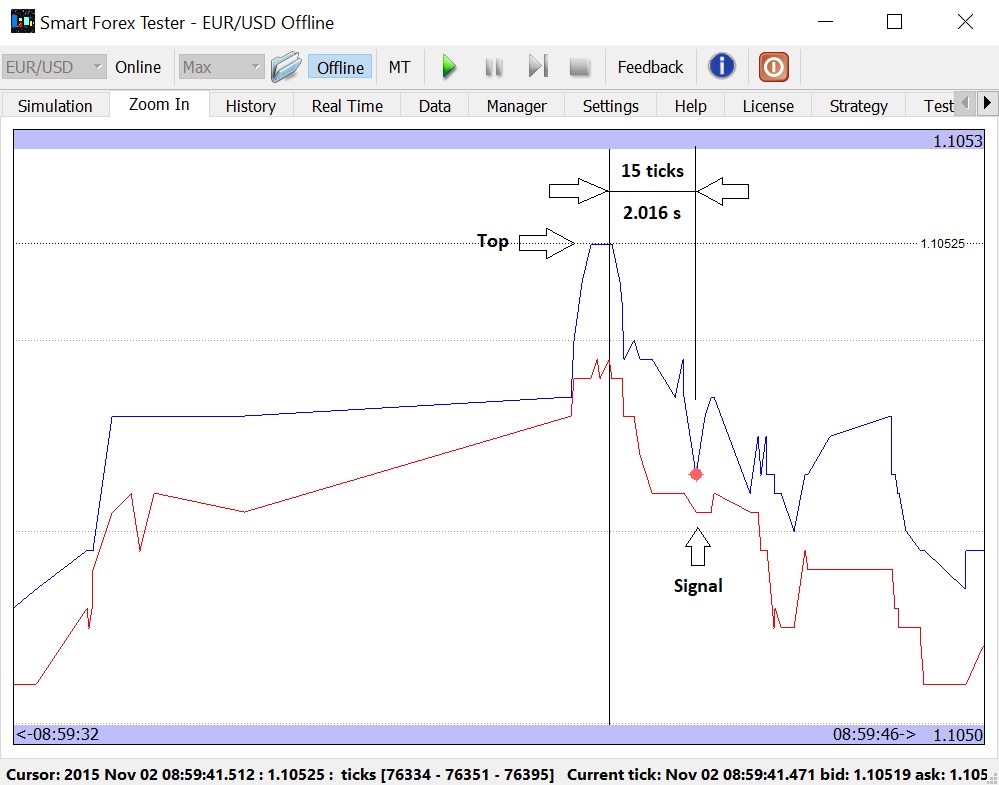
So, the top we marked on the graph only lasted about 300 ms – but during this time there were 4 ticks.
You may notice that our algorithm fired a signal just 15 ticks after the top (check the cursor position on both graphs) – within just 2 seconds!
Just think of it.
Imagine you were trading manually and staring at your terminal all this time without a blink. Looking at this messy fast-changing chart, not only did you need to make a decision, but also place an order. Could you do it in 2 seconds?
But the software could open a position on the same tick the signal was generated.
Under the hood (from passion to solution)
How did we come to the idea?
We’ve tested multiple approaches – to no avail. First of all, we used different indicators and their combinations for market timing. But test after test after test failed.
It took us quite a while until we realized that we can try to treat the market price action as a signal, as there are clear similarities between them.
Turns out, signal processing happened to be our passion for many years. And we’ve gained a lot of experience there.
So, it didn’t take us long to decide that we should attempt to apply our skills to develop an algorithm that would signal the moments when price reversals happen.
The problem is, there is a lot of price swings all the time. To be of any use, the algorithm should be able to discard all the noise from the price action and only signal when a major reversal happens.
Suddenly our expertise in signal recognition from the background noises came really handy.
But still, it took us several years of researching the internal structure of the price “signal” to find the reversal signs, and develop the algorithm and software to make use of them – both in manual and automated trading.
Note that our algorithm doesn’t try to predict anything. Nor does it do any approximations – you just can’t approximate the reversal.
But the principal importance of the algorithm is that it is able to signal the price extremes very fast. Which simply means you can front-run the crowd and have time to enter or exit the market before them.
That was really exciting.
But another discovery we made was even more amazing. We noticed the algorithm’s behavior in trending markets becomes different.
Look at the below example.
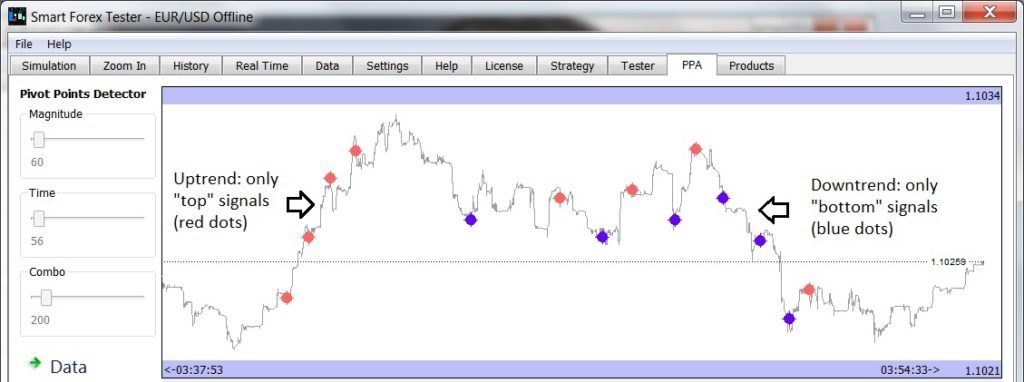
When the market starts trending, the algorithm only detects extremes in the trend direction! On the picture, compare the small trends (marked by arrows) with the flat market in the middle.
Turns out, this is no coincidence. The internal structure of the price action that our algorithm detects, is just not present in the counter-trend moves.
This equipped us with very powerful knowledge.
First of all, we can use it as a trend indicator. Which works with a minimum lag – if the algorithm sensitivity is set to high (as it is on the picture). Note the time difference between the signals.
Next, if we only could adjust the algorithm sensitivity independently in each direction, we would be able to make it “tune” on the trend automatically. We are currently researching how we can accomplish it.
Just imagine what could we achieve if we don’t need to advice the algorithm on the big picture!
For now, you can simply switch the working strategy manually according to the changes in the market. The software makes it quick and easy – even on the fly.
Finally, a curious story from our practice illustrating the importance of manual switching.
Once, when we were still working on the prototype of our current software, as a stability test we left an automated strategy based on our algorithm running for a day on the live EURUSD data feed.
Accidentally, on that same day a major news triggered a huge sell-off in the Euro.
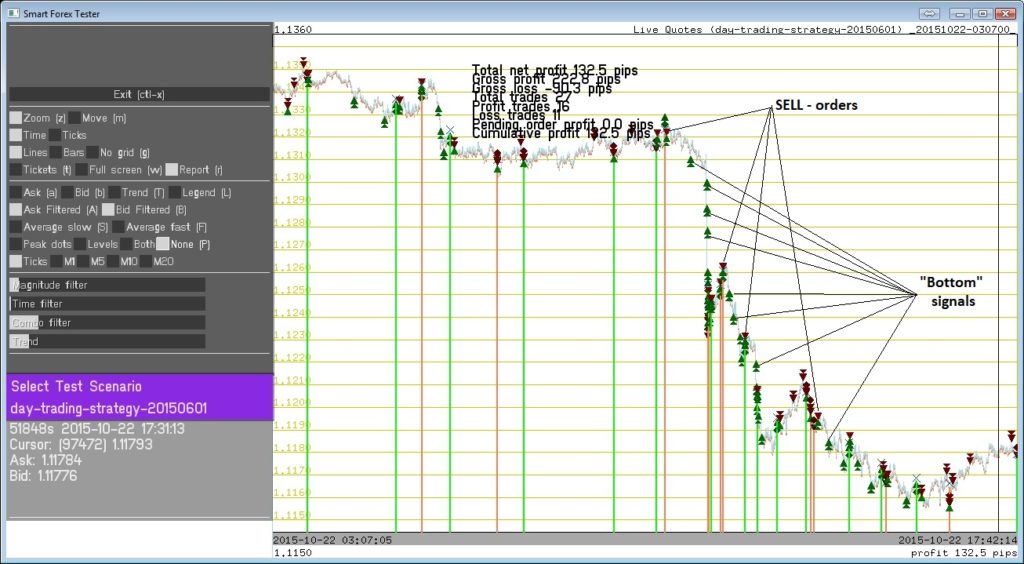
When we checked the test in the evening, we were stunned: the algorithm won 132 pips, and the bulk of this profit was made during just a several hours long powerful downtrend that started after the news.
Our automated strategy managed to position itself in the direction of the trend multiple times- most importantly, just before the sell-off. Look at the graph: the timing for the “SELL-orders” is nearly perfect. And the algorithm kept generating only “bottom” signals along the trend and let the profits run.
We are not showing this test result to brag about our excellent market timing – we admit in this case a great deal of luck was involved.
Instead, we just want to point out that you could have similar results if you opened a short position yourself after the trend already started. Because the software would work the same way once positioned properly. This is what really matters!
Quite often, similar trading setups follow major announcements like rate decisions. You can combine your judgement and experience with the power of software – and benefit from delegating the routine to the computer, which is much better at it.
Sounds too good to be true?
Fair enough.
First of all, note that we are not offering a mysterious black box making money when you sleep. This would be irresponsible – there is no silver bullet in day trading.
That said, properly used, our software can definitely help you succeed.
You don’t have to take our word for it – test it yourself!
Because you will get you all you need for that – our software comes with 100% accurate market simulator and tester tools.
You can test both on historical prices and on live market. You can run tests manually or use inbuilt test automation engine.
For the back testing, free high quality tick data is available since 2009. For the forward testing, you can either use an inbuilt real-time data feed, or connect directly to your MT terminal.
You can get started with back testing instantly with the inbuilt market data – we used it ourselves in most of the examples, and you can run them as well.
Bottom line, you can run all possible testing for every detail of what we just presented – before taking any risks.
How about false alerts? Obviously, at times the algorithm fails to find a true reversal point.
We’ve just discussed that with the current version of the algorithm, this nearly always happens when the market is trending.
Let’s take an example – the very beginning of a trend. This situation is very important. The earlier we position ourselves in the direction of the trend, the easier we can profit.
The problem is that we don’t know if a swift market movement is a beginning of the trend or not.
So, until we don’t have firm evidence of the trend, when a market extreme happens, it makes sense to enter in the opposite direction. For example, if we see a bottom, we need to open a long position.
If a trend happens to start soon after that, our trade will be a loser. But we have no way of knowing that beforehand.
Let’s take an example of this situation.
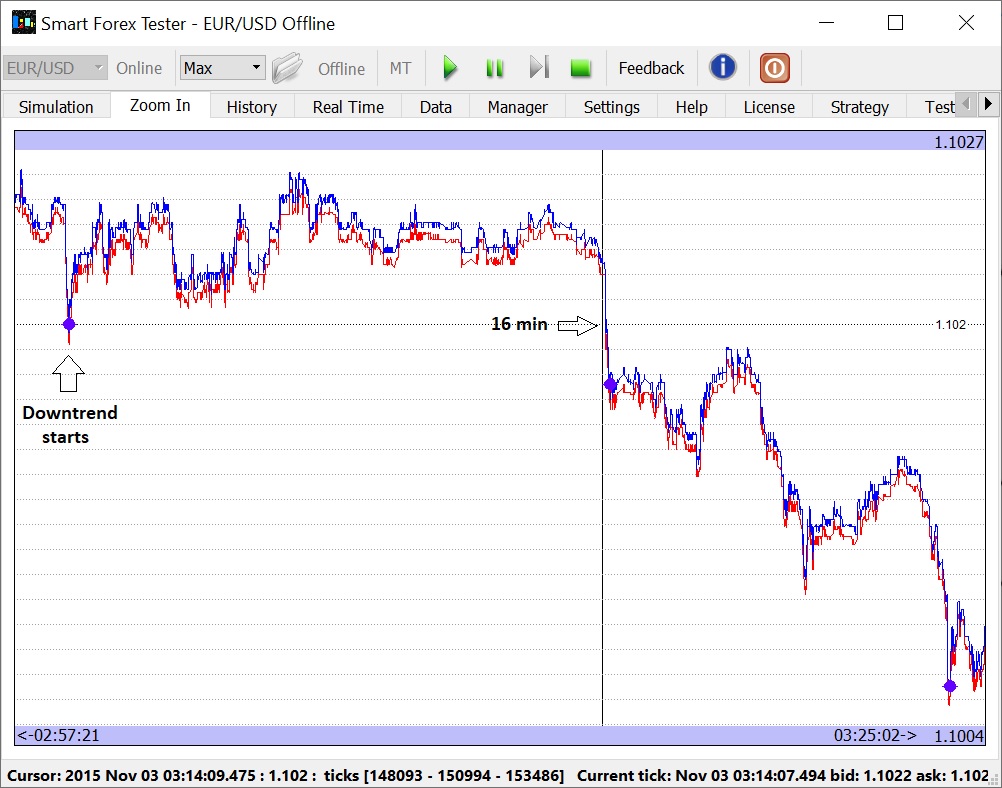
Our algorithm signaled a reversal – the blue dot on the left. However, this was a false signal. This was the first bottom of a downtrend. What the algorithm considered the bottom, turned out to be just a local extreme.
But here’s the thing: even though local, we still have an extreme.
Why is this i
The keyword here is “slow” – this means have time to make a decision and exit if you think you should – before the losses start to
Take a look at the picture: it took the market almost 16 min to drop below the level where the signal was fired. And during this time, there was a plenty of opportunities to exit even with up to 5 pips of profit – thanks to an accurate market entry. Even though it was a false signal, overall.
What’s in it for ME?
Once we received the following feedback: “I’m a manual trader – I don’t need all that”.
We can’t agree. Even if you want to place all your trades yourself, you can still benefit a lot from our software. At the very least, you can use it as a signal generator, and it will unchain you from your computer.
Scalping. Here you can let the software to enter the market. Then you can see for yourself when to take the profit manually.
Trend following. The market is either trending or not. Some studies show trends occur only 20% of the time. But trends are the best profit opportunity, so we need to use them as much as we only can.
On the trending market, the benefit of our algorithm is that it starts detecting the extremes only in the trend’s direction. We’ve just shown you an example how we can profitably use this.
You can also let the algorithm take the profit at the extreme, but then enter the market manually after a corrective move.
More to it, we are now working on enhancing the
Switching strategies on the fly. The situations above can be switched by a press of a button*. Like the presets you use in your car radio.
However, you can have the best of both worlds if you monitor it. Every time the algorithm places a trade, you will have a sound signal. You can review the market entry and close the position manually if you don’t like it.
Trading automation will give you even more benefits – you can go as deep as you need if you want to and are proficient in programming. Because our software includes a full-fledged C++ engine where you can code any strategy you want.
Manual trading is time-consuming. Trading automation not only saves your time, but also is the best way to reduce stress – the #1 reason for the trading losses.
Even a quite simple strategy that uses our algorithm for timing can run without your supervision. And in non-trending markets, it is winning quite often: test that yourself!
More benefits (that you might not even think of)
We don’t offer you a mysterious black box strategy. Instead, we offer a vital building block. Which can be a strategy on its own – OR added as a part to any other strategy.
Adding sharp market timing to lagging indicators will give you the best of both worlds. Otherwise, you could lose tens of pips on entry and exit – because of the seesawing of the market.
Seamless switching between testing and trading. You can test and trade with the same strategy in the same setup. For example, start with back testing on today’s market prices, make adjustments to your strategy and then put it to trade.
Combining auto and manual trades. The software makes the timing signals also available in your automated C++ trading strategy. It gives you an enormous potential.
Computers are tireless in waiting and lightning fast in acting. But it is you who have the brain. It’s a win-win.
Similar to the auto-pilot in an aircraft, automation is the best way to get rid of routine and time-consuming activity. An automated strategy monitors the situation way more reliably than you and reacts much faster.
For example, you can delegate the market entry task to the algorithm. Then you can decide yourself what to do and when to exit the trade manually.
Alternatively, you can enter the market manually, but then delegate the tracking of your position to the automated strategy. Obviously, reversal signals let you implement a very flexible profit taking logic – compared to regular (even trailing) stops. Remember a trend following example?
We are sure you fully understand the unique benefits you will get from our market timing algorithm.
So, let’s now take a look at the software that implements the algorithm in practice.
Introducing Smart Forex Tester Suite
The software was first launched to our subscribers at the end of 2016.
Market timing is a very important, but not the only part of the Suite’s functionality. This software is a powerful
For trading automation, the Suite includes a full-fledged C++ environment and the automated strategies you develop there have real-time access to all the market timing signals.
Strategy Tester never interpolates tick data, provides 100% market modeling quality and accuracy of up to 1 ms in offline tick rendering. Quick test mode is supported. Test scenarios can be run in batches. Data Manager makes preparing test data very easy.
Forward testing is supported both on the inbuilt live data feed (10 main currency pairs), or by connecting the Suite to your MetaTrader terminal with a provided EA.
Your great benefit of the Suite is seamless switching between testing and trading*.
First of all, you can always trade with exactly the same strategy you’ve just tested. For example, first test on recent prices offline, and then switch to the live trading.
In addition, the Suite’s testing engine doubles as a Trading Simulator, both offline and online. Trading practice with the Simulator is way more efficient and faster than on any demo account.
Offline Simulator lets you practice on weekends when the market is closed. Fast forward feature lets you skip the dull time on a slow market without losing any action. Slow motion feature helps you practice on a fast market, e.g. news trading.
Online Simulator provides a unique Time Shift feature to pause a live data feed, so you can manage your time and take breaks whenever needed. And when you resume the data feed, all the offline data speed manipulation options will become available, as well.
Now, let’s sum up what you get in the latest edition of the Smart Forex Tester Suite:
OFFLINE Trading Simulator
- test even when the market is closed
- 100% modeling quality
- up to 1 ms accuracy
- varying data speed (slow motion to MAX)
- trading server delay
- pivot points signals
ONLINE Trading Simulator
- instant live access to 10 main pairs
- live data feed from Meta Trader
- live tick data recording
- Time Shift for time-saving
- live pivot points signals
Strategy Tester
- Test automation framework
- C++ development environment
- source code EA-compatibility
- pivot points signals in C++ code
- trade analyzer
- Batch testing mode
- Quick test mode
- Test Manager
Data Manager
- Easy test cases preparation
Quite a bunch, right? And FREE software updates for life is included.
After your payment is completed, you will get an email with the link to the download page and the instructions on how to get your license code.
It’s really very easy to order.
Just click on the below button to order with your credit card or PayPal online
You will get immediate access – even if it’s 2 AM
And you don’t have to worry…
Because Your Satisfaction Is 100% Guaranteed!
We want you to feel safe pressing the link and getting our Software.
So here’s the deal:
to see what you think. If it doesn’t live up to your best expectations…
…then just write us an email saying so. We’ll refund your investment ASAP. No questions asked.
Still not convinced?
We have been testing our automated trading strategy 24/5 and the results were stunning – it delivered profit week after week for over 4 month in a row.
We published each and every week‘s test results on our blog. Here’s some highlights:
October: 932 pips (including 422 pips during the 2nd week and 310 pips during the 3rd week).
November: over 1,000 pips – including 514 pips during the 1st week.
December: 2,100 pips (including 802 pips during 2nd week and 919 pips during short Christmas week).
The results of testing this long can’t be a coincidence. We consistently observe the same pattern of steady profit growth, little draw-down and win ratio exceeding 50%.
YES! I want to get the Smart Forex Tester Suite For One-Time Payment of $597